Anatomy of a blackout: beyond the inertia argument
Currents: AI & Energy Insights - April 2025
Welcome back to Currents, a monthly column from Reimagine Energy dedicated to the latest news at the intersection of AI & Energy. Every month, I send out an expert-curated summary of the most relevant updates from the sector. The focus is on major industry news, published scientific articles, a recap of the month’s posts from Reimagine Energy, and a dedicated job board.
1. Industry news
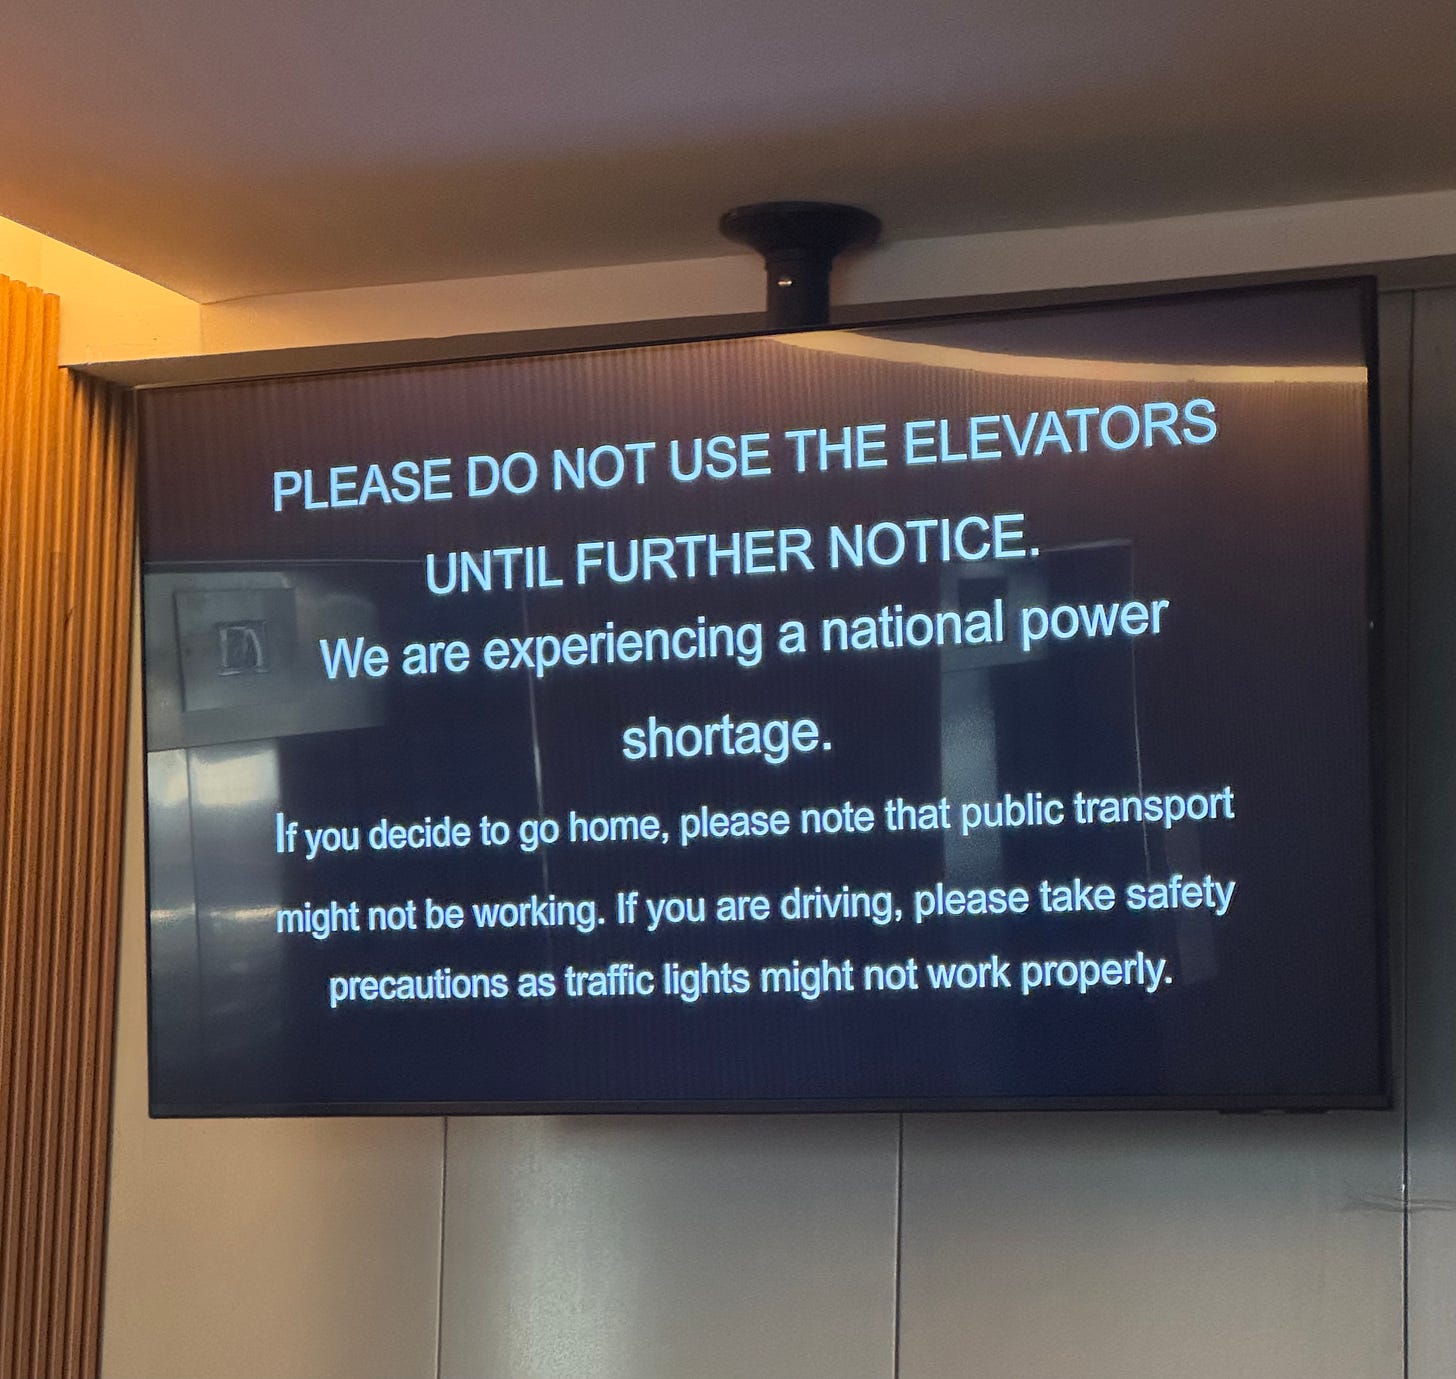
On April 28, a massive power blackout struck the entire Iberian Peninsula and parts of southern France. Around 12:33 CEST that day, lights went out for tens of millions of people in an unprecedented grid collapse for a European country. Essential services were disrupted: airports, hospitals, public transport, telecommunications, and industry all ground to a halt. Power restoration took many hours, with some areas (including my house in Barcelona) in the dark for more than eight hours before supply was fully reestablished.
While we’re still waiting for the official investigation to be concluded, and a report to be published, there are already interesting data that we can analyse. In this issue, I will unpack the facts known so far, what are the leading theories, and, of course, the role that AI can play in preventing future events like these.
Facts: what we know until now
Piecing together reports from ENTSO-E1, Spain's Red Eléctrica2, and various energy analysts3, the following timeline has been reconstructed:
In the hours and even days leading up to the main event, the Iberian and wider European grid experienced notable inter-area oscillations and voltage disturbances. On April 28, around 12:20 PM CEST, significant oscillations were observed, potentially stressing the system.
At 12:32:57 PM, in a rapid-fire sequence lasting about 20 seconds, at least three different generators tripped offline in southwest Spain, totaling around 2.2 GW. The reason behind these trips is still unknown.
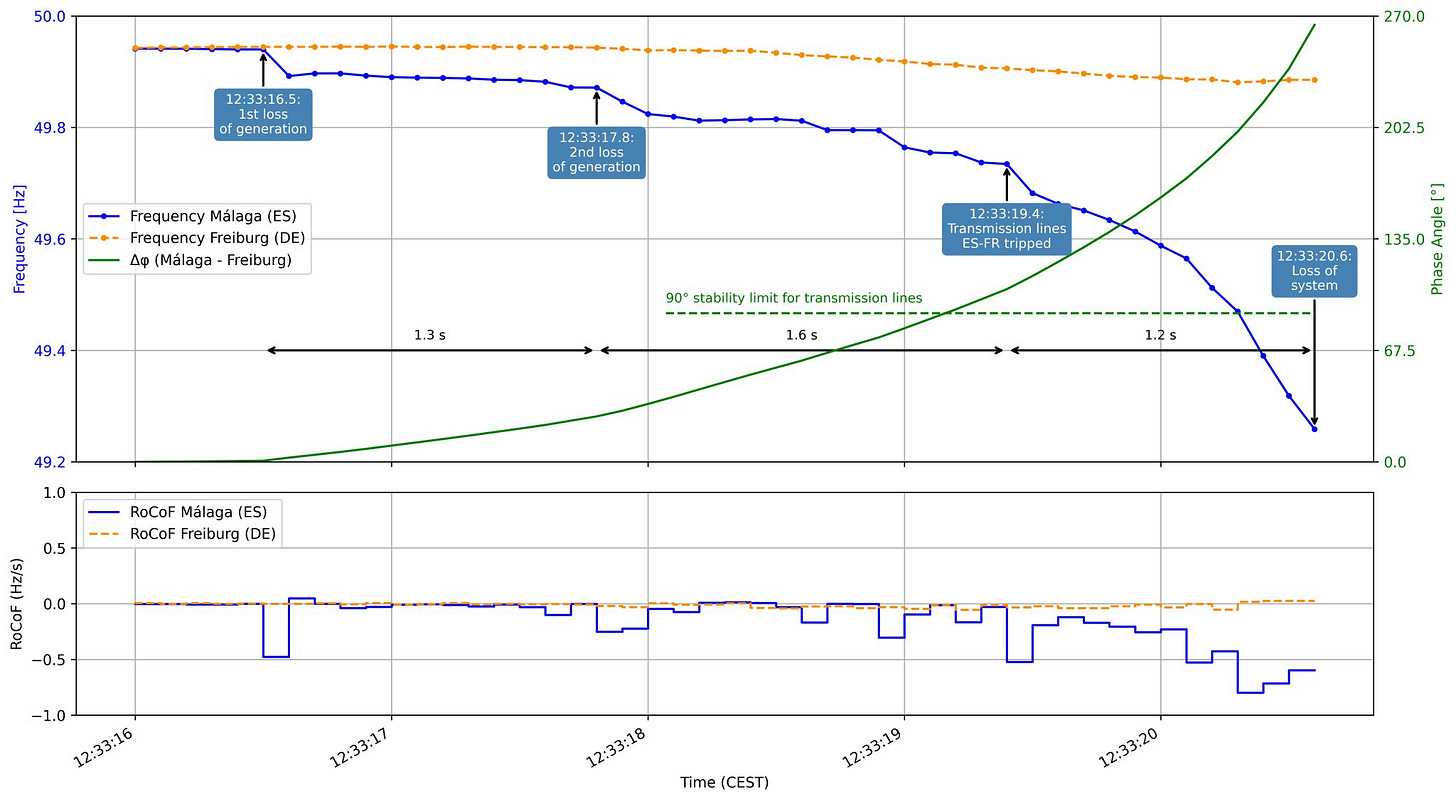
This rapid 2.2 GW loss triggered a sharp decline in the Iberian grid's frequency. Protective measures, including Under-Frequency Load Shedding (UFLS), reportedly activated around 48 Hz. However, by 12:33:20 CEST, the phase angle difference between Iberia and the main European grid became too large, leading to the tripping of AC interconnectors with France. Iberia became an electrical island.
Once islanded and already severely generation-deficient, the Iberian system couldn't stabilize. A "massive disconnection of generation" occurred within the newly formed island, leading to a full blackout by approximately 12:33:24 CEST.
In the image below, we can see the three generation loss events within a few seconds, the frequency dropping in Málaga, as well as the rate of change of frequency (RoCoF), and the phase angle between Spain and continental Europe quickly increasing well over the 90° stability limit for transmission lines.

What does it mean that the phase angle difference led to the interconnectors with France tripping?
In an AC power system, voltage and current are not constant; they oscillate as sine waves. Generators across interconnected grids like Europe's must maintain synchronism, meaning aligned voltage frequencies and phase angles. When Spain lost significant generation, its generators slowed, causing its voltage phase angle to lag behind the stable European grid (represented by France). This growing phase difference triggered a massive power surge from France to Spain as the system tried to pull Spain back into sync. However, interconnectors have phase angle stability limits and exceeding these risks a dangerous loss of synchronism and widespread damage. To prevent this, protective relays detected the excessive phase angle difference and automatically tripped the interconnectors, safely islanding the Iberian Peninsula.
Renewables as the scapegoat

Many initial analyses of this event focused on the role of low system inertia in the blackout. Inertia, traditionally provided by the spinning mass of large fossil fuel and nuclear generators, acts like a shock absorber for the grid, resisting rapid changes in frequency when generation and load become imbalanced.
As grids integrate higher shares of inverter-based renewables (like solar and wind), which don't inherently provide this spinning inertia, the overall system inertia can decrease. The supporters of this maintain that had there been more inertia, the frequency wouldn't have dropped so quickly after the initial generation losses, giving the system operator more time to act and potentially averting the full collapse. This narrative leads to calls for slowing down renewable deployment or keeping fossil fuel plants online purely for their inertial properties.
An alternative explanation: overvoltages and Rate of Change of Frequency (RoCoF) relays
While low inertia undeniably makes a grid more sensitive to frequency deviations, there are also other theories. Luis Badesa, a Professor of Power Systems at UPM, points out that the initial 2.2 GW loss constituted an N-3 contingency (at least three separate generation losses). He then argues that no Transmission System Operator (TSO) would typically plan or carry enough inertia to withstand an N-3 event, especially while subsequently operating as an electrical island. The real problem, therefore, started before the final, inertia-exacerbated frequency collapse.
The key questions then become:
What caused the initial, correlated generator trips? There has been no official confirmation yet, but different analysts and reports reports suggest overvoltages in Southwest Spain, possibly linked to the earlier inter-area oscillations, could be a strong candidate. If so, the initial problem was one of voltage stability and a cascade of trips triggered by that, rather than a primary frequency issue.
What caused the final "massive disconnection of generation" after Iberia was islanded? While we’re still waiting for Red Eléctrica and ENTSO-E to provide an official report, the hypothesis advanced by Prof. Badesa is that the N-3 event caused the grid frequency to change really quickly, potentially triggering Rate of Change of Frequency (RoCoF) protection relays for more generators. RoCoF relays are protective devices that monitor the speed of frequency change in a power system. By detecting the rapid frequency change that often occurs when grid connection is lost, the RoCoF relay trips the generator before it can operate in an unstable islanded mode for a prolonged period. This prevents potential damage from off-nominal frequency/voltage operation. This is how the N-3 event could have cascaded into a complete system shutdown.
According to this theory, low inertia played a role in the final stage of the collapse within the island, but it wasn't necessarily the root cause of the initial N-3 contingency that pushed the system into a highly unstable condition.
Enhancing grid resilience and demand-side flexibility
If Professor Badesa's line of reasoning holds, then the most effective solutions go beyond simply adding inertia or relying more on fossil fuels. Instead, we need to focus on:
Preventing the N-3 event: This means thoroughly investigating and addressing the root cause of those initial correlated generator trips. If overvoltages were the issue, there are solutions such as enhanced voltage control, better damping of inter-area oscillations, robust network infrastructure, and appropriate generator protection settings for voltage ride-through.
Revising RoCoF protection strategies: RoCoF protective relays shouldn't trip prematurely before faster-acting resources can respond, especially in an islanded, low-inertia scenario.
Deploying rapid, large-scale Demand-Side Flexibility and storage: Had the Iberian island been able to rapidly shed over 1-2 GW of load (DSF) or inject a similar amount of power (from batteries providing Fast Frequency Response) within seconds of the 2.2 GW loss, it might have stabilized frequency quickly enough to prevent widespread RoCoF trips and the final collapse.
Installing Grid-Forming Inverters (GFMs): GFMs are inverters that can rapidly inject or absorb power in response to frequency deviations, mimicking the stabilizing inertial response of spinning generators. Integrating renewables and batteries with GFM capabilities would allow them to actively contribute to grid stability by providing synthetic inertia and maintaining voltage and frequency.
Improving interconnection with France: As visible in the image below, the interconnection between Spain and France is limited to a few points across the Pyrenees. This is a known bottleneck that restricts the amount of power that can be exchanged between the Iberian Peninsula and the wider Continental European grid. While the interconnectors correctly tripped to protect the larger system during this event, greater interconnection capacity would offer several benefits for resilience.

What I’m thinking
Many analyses blaming renewables come from authors without power‑system expertise and often lack data. These interpretations are also highly politicized, and come from organizations attempting to advance their own agendas.
Without more information, we can’t draw definitive conclusions at this stage. All I will say is that if, as has been suggested, the incident involved three generators tripping due to overvoltages, then, while increased system inertia is certainly beneficial for the resilience of any power system, it likely could not have prevented this blackout.
Regardless of this event’s specific cause, several concurrent trends are undermining the stability of our grids: higher renewable penetration, the electrification of heat and mobility, the growth of data centres, and more frequent extreme weather events. While no single technical solution exists for this massive engineering challenge, two pillars will certainly be the digitalization of the grid and enhanced control of demand-side resources in response to grid conditions. There were 19 seconds between the first and second generation loss events. This timeframe could have been sufficient to disconnect a fleet of EV chargers, reduce the load of a data centre, or temporarily curtail HVAC systems in a portfolio of commercial buildings. This might have mitigated the impact on frequency, potentially avoiding the subsequent islanding and shutdown. With the economic damage from this blackout estimated at 400 million euros4, this appears as an extremely complex problem, but one that is clearly worth solving.
Have you explored any interesting theories behind the Iberian blackout? I would love to hear them!
2. Scientific publications
Causally predicting control scenarios with Double Machine Learning
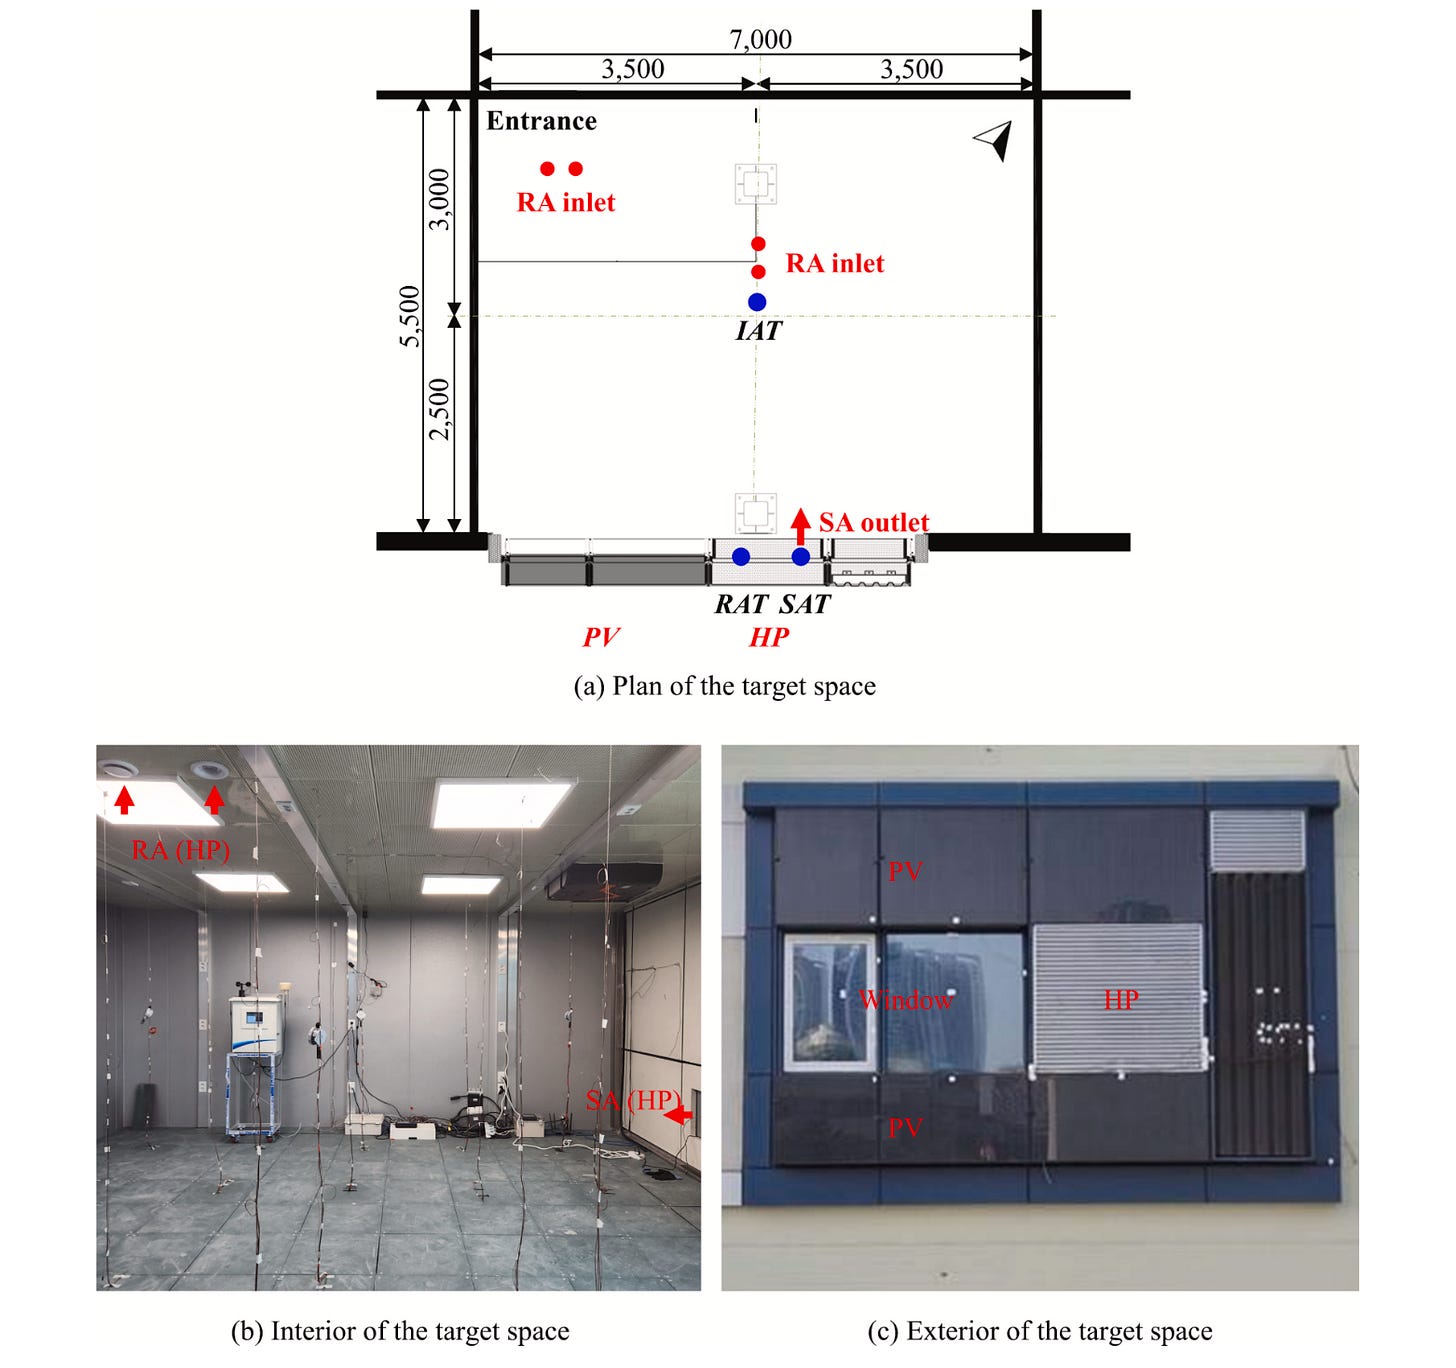
Beyond correlation: A causality-driven model for indoor temperature control introduces a double‑machine‑learning (DML) framework that learns the causal impact of heat-pump set‑point temperature on indoor air temperature. The algorithm was tested in a 38 m² office lab using 3,781 ten‑minute datapoints collected over 28 days.
What I’m thinking
Standard machine‑learning models often rely on statistical correlations that don’t reflect true cause‑and‑effect, leading to poor performance under new conditions. When directly controlling buildings, this is usually solved by using grey‑box models that blend physical and statistical modeling.
The proposed DML approach seems interesting in that it allows us to define a causal “what‑if” scenario. This could prove very useful when assessing the potential impact of different control strategies and evaluating the trade‑off between energy savings and comfort. One issue I see is that it was tested in a small office space with a lot of monitoring. Translating this to larger buildings with less data will certainly be a challenging task.
A new building dataset with 10,000 timeseries data points
BTS: Building Timeseries Dataset: Empowering Large-Scale Building Analytics. This paper, presented at NeurIPS 2024, introduces a dataset that covers three diverse Australian buildings over a three-year period, encompassing over 10,000 timeseries data points and 240 unique ontologies, all standardized using the Brick schema. The data and accompanying code are published openly on Github.
What I’m thinking
It’s always exciting when datasets with so much detail are published. By keeping the data raw, including missing values, mislabeled alarms, etc., the authors give us something closer to production reality than to a Kaggle competition. This can be great for stress‑testing automated cleaning, anomaly‑detection workflows, and defining control strategies that are robust to real-world operation.
3. Reimagine Energy publications
In my latest Python tutorial I use publicly available data to show how rooftop solar PV savings are affected by volatile electricity markets in Germany.
4. AI in Energy job board
This space is dedicated to job posts in the sector that caught my attention during the last month. I have no affiliation with any of them, I’m just looking to help readers connect with relevant jobs in the market.
PhD student in development of digital twins for buildings at Uppsala University
Data and AI Strategist at Siemens
Data Science Forecaster at Eneco
Conclusion
With so much going on in the sector, it’s not easy to follow everything. If you’re aware of anything that seems relevant and should be included in Currents (job posts, scientific articles, relevant industry events, etc.), please reply to this email or reach out on LinkedIn and I’ll be happy to consider them for inclusion!
https://www.entsoe.eu/news/2025/05/09/entso-e-expert-panel-initiates-the-investigation-into-the-causes-of-iberian-blackout/
https://www.ree.es/es/sala-de-prensa/actualidad/nota-de-prensa/2025/04/proceso-de-recuperacion-de-la-tension-en-el-sistema-electrico-peninsular
https://www.linkedin.com/posts/leonhard-probst-4b2666284_blackout-stromausfall-apagaejn-activity-7323704785575030786-X1if
https://www.linkedin.com/posts/luisbadesa_iberia-blackout-2025-activity-7326913857451384833-Ikuc
https://www.linkedin.com/posts/marta-victoria-4189b388_im-teaching-a-course-on-integrated-energy-activity-7325467309462974477-PWt5


🙌🏿
I'm pretty sure that your graph of the power distribution is wrong, and that actually power generation was zero for a few hours. REE automatically generated data is often misrepresented.
Check energy-charts, they have now corrected this